Over the last decade, CAS Group has been actively involved in developing environmental criteria in support of a wide range of projects worldwide, including numerous LNG terminals. In addition, we are often asked to review existing or in-progress siting studies. During our review of such siting studies, we have identified several issues which we believe could have been avoided if the considerations listed in “Part 1: Analysis of Wind Data in Support of Siting Studies for LNG Facilities” were considered. The two case studies shown below illustrate, in practical terms, the importance of proper analysis of environmental data.
Case Study 1
CAS Group was asked to review the siting study for a proposed LNG terminal in the United States. The terminal is located along the coast. Based on a review of the siting study, we determined that wind speeds acquired at an airport, located about 15 km inland from the project site, were used to develop wind parameters for the hazard studies. CAS Group independently acquired the raw wind data collected at the aforementioned airport and plotted the frequency distribution of the wind speeds, which is shown in Figure 1 below.
A visual inspection of Figure 1 shows a rather unusual distribution of the wind speeds. Indeed, the record did not contain any wind speeds greater than 0 and less than 3 mph. After further investigation, we determined that station considered all wind speeds less than 3 mph as calm and thus were assigned a speed of 0 mph. This finding was not considered when the wind climate for the siting study was prepared. Therefore, this omission resulted in over 20% of the wind speed observations as being classified as calm, thereby the 10th percentile wind speed was determined to be zero. Consequently, a 1 m/s was adopted for the vapor dispersion modeling which resulted in a large hazard zone.
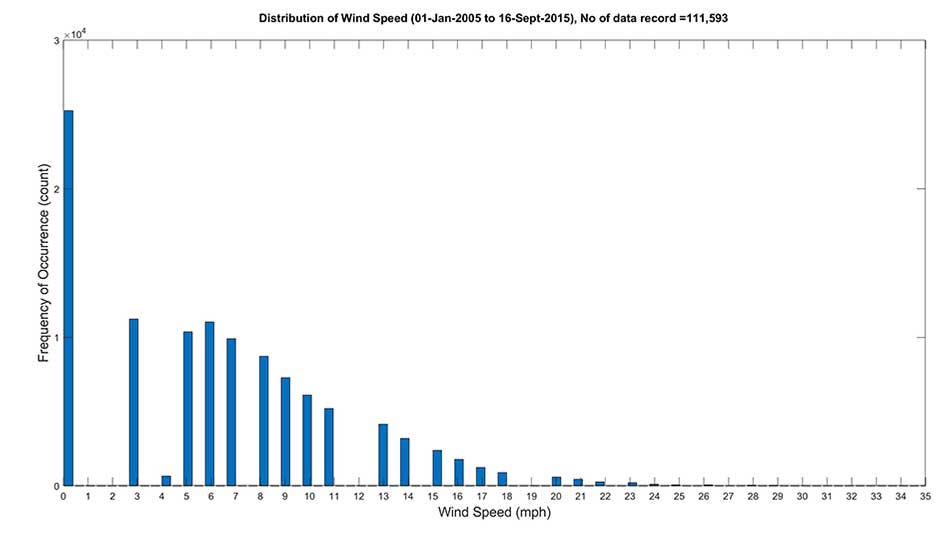
Figure 1 – Distribution of Wind Speed at Originally Selected Meteorological Station.
Another observed idiosyncrasy was the fact that wind speeds were recorded in mph (not knots or m/s) and the wind speeds were rounded to the nearest integer.
Based on our findings, it was evident that the meteorological station that was selected was not suitable for the purposes of establishing meteorological parameters for a siting study.
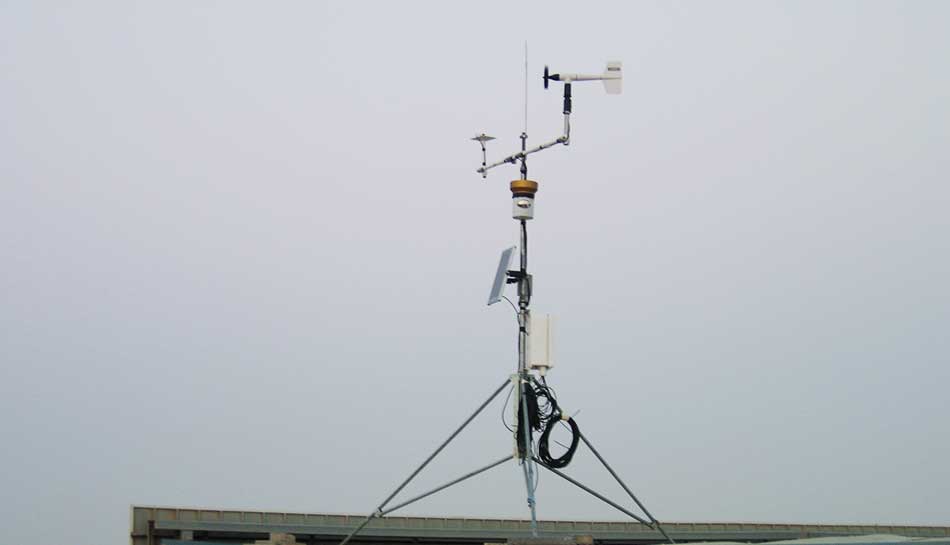
CAS Group performed an audit of the available meteorological stations in proximity to the project site. A coastal meteorological station located about 10 km from the project site was identified. This station was not only closer, but climatic conditions at the new station appear to be more representative of those observed at the project site. This was established after a short-term comparison of the prevalent meteorological conditions at the site against those at the coastal meteorological station.
This station was not only closer to the project site, but climatic conditions at the new station appear to be more representative of those observed at the project site. This was established after a short-term comparison of the prevalent meteorological conditions at the site against those at the coastal meteorological station.
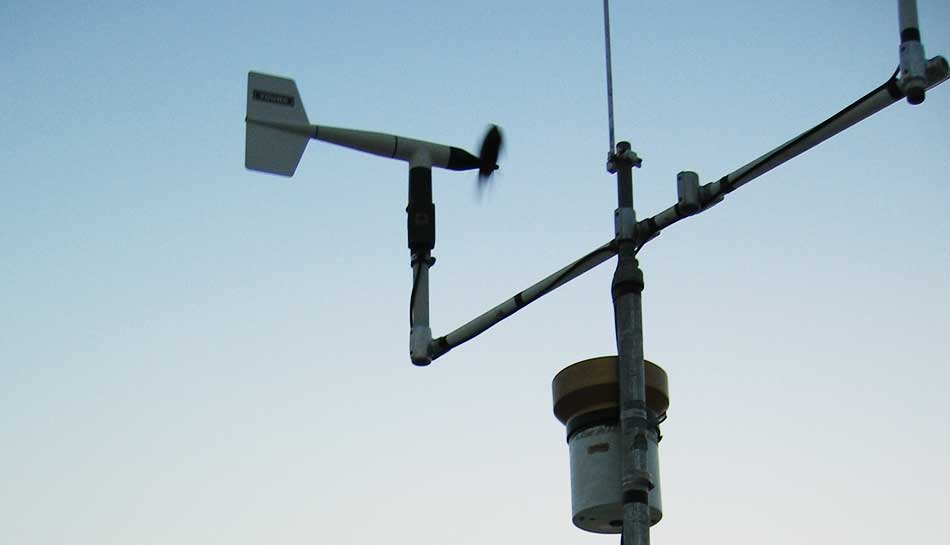
During our due diligence, we established the height of the anemometer at the new station to be 5.7 m. Additionally, our investigation showed that the height or type of anemometer had not varied during the course of the observations. Furthermore, it was established that the wind speeds were 6-min wind speeds collected once every 10 minutes.
The long-term windspeed time-series underwent a thorough quality control process. Identified gaps appeared to be random and no systematic, seasonal data gaps were observed. The quality checked wind speeds were adjusted to a 10-m anemometer height.
Figure 2 shows the distribution of wind speeds at the new meteorological station. It is important to note that the distribution of the recorded wind speeds matches well the expected theoretical distribution of environmental data (e.g., Weibull distribution).
The checked and adjusted time-series was analyzed to estimate the 10th percentile wind speed, which was in the order of 1.6 m/s (see Figure 3).
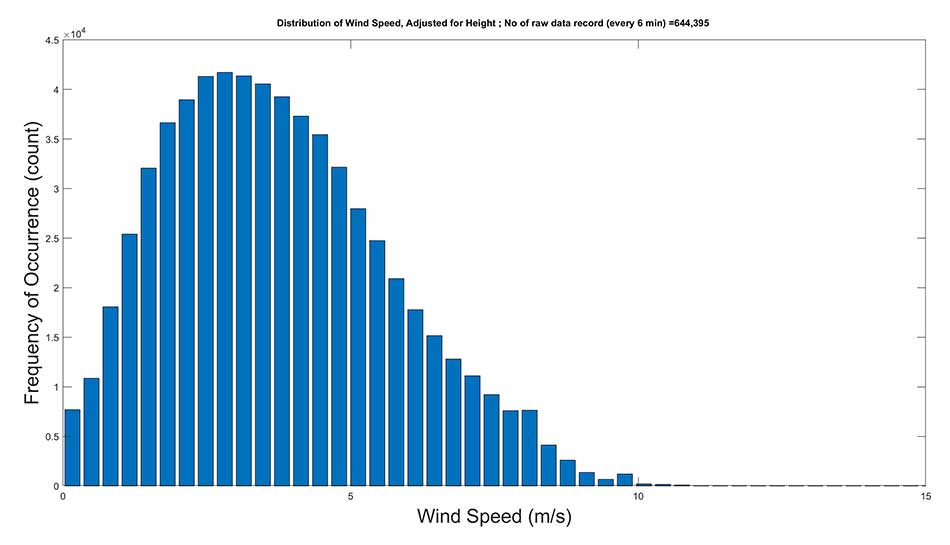
Figure 2 - The Frequency Distribution of Wind Speed at Alternative Meteorological Station.
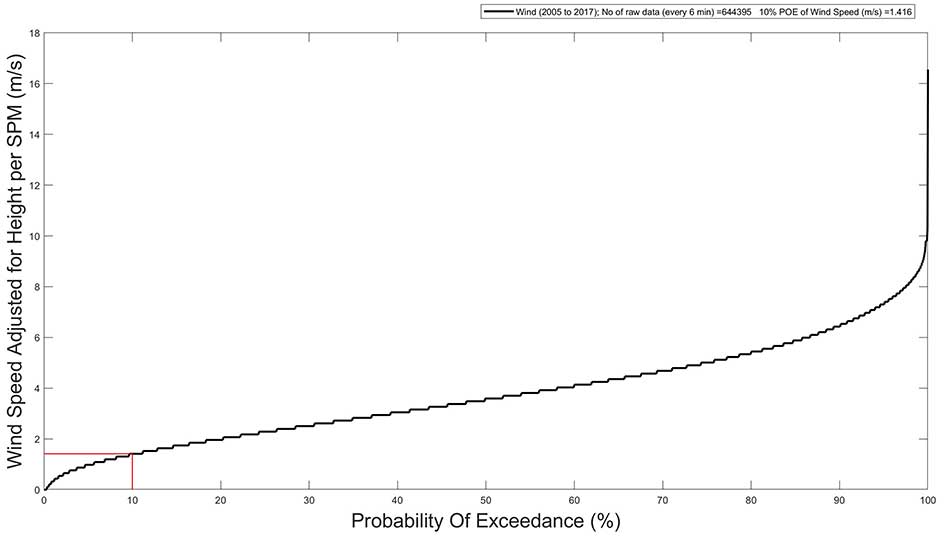
Figure 3 – Probability of Exceedance Wind Speed at Alternative Meteorological Station.
Case Study 2
CAS Group was retained as the technical advisor by a fund pursuing an investment in a proposed LNG Export Terminal. As part of the due diligence effort, CAS Group was asked to review the siting study for a proposed LNG facility.
The proposed site is along the coast. We were advised that the 10th and 90th percentile wind speeds, 2.1 m/s and 8.8 m/s, respectively, were developed based on analysis of a 60-year wind speed record collected from a nearby meteorological station.
Based on CAS Group’s prior experience at other sites near the project site, concerns about the selected wind speeds were identified as a result of which the raw wind data for the meteorological station used in the initial analysis was secured and re-analyzed by CAS Group. Our re-analysis showed that the correct 10th and 90th percentile wind speed to be 1.3 m/s and 9.0 m/s, respectively. A comparison between the probability of exceedance curves is shown in Figure 1.
We identified several issues with the original analysis of wind data. These included the use of wind speeds that were not adjusted to 10 m anemometer height; inexplicable use of subsets of the available record as opposed to the full record; and incorrect quality assurance and interpolation of the recorded wind speeds resulting in the introduction of an artificial bias in the time-series.
As a result of the reduction in the wind speed for dispersion modeling, several changes to the projects were necessitated.
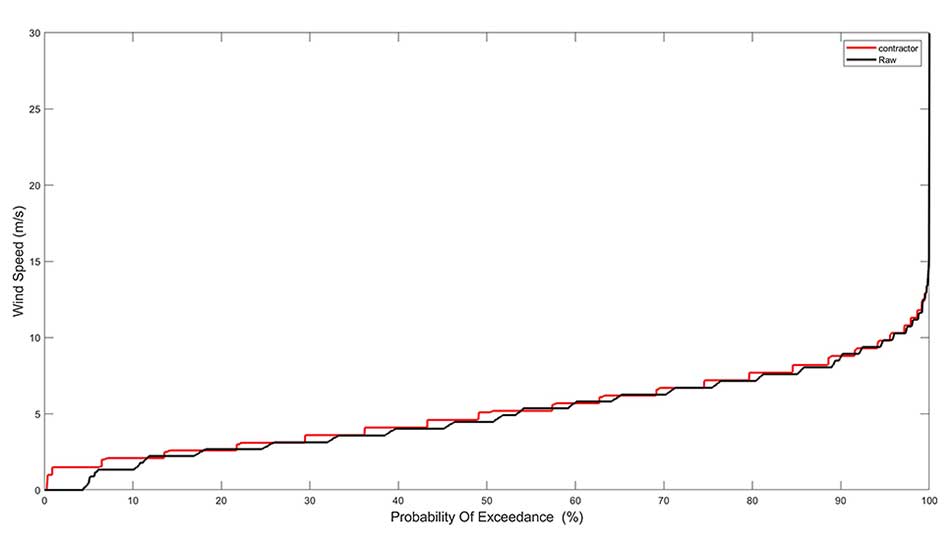
Figure 4 – Comparison Between the Original Probability of Exceedance Curve (red) and the One Prepared by CAS Group shown in black.
* * *